Rancher MonitoringのPrometheus AdapterでNGINXをオートスケールする
Rancher Monitoringアプリ に Prometheus Adapter が標準装備されていたので使ってみました。
以前Rancherで構築した、ラズパイクラスター
で試します。
ラズパイクラスターでもMonitoringが動いたのでそこで試します。
確認したバージョンはv100.2.0+up40.1.2です。
PrometheusでNGINXのメトリクスを取得する
まずNGINXでメトリクスを公開して
NGINX Prometheus Exporter
を使い
prometheusで監視できるようにします。
GCP向けですが、こちら を参考にさせていただきました。
NGINXの設定ファイルを準備します。
ubuntu@k8s1:~$ cat default.conf
server {
    listen       80;
    listen  [::]:80;
    server_name  localhost;

    #access_log  /var/log/nginx/host.access.log  main;

    location / {
        root   /usr/share/nginx/html;
        index  index.html index.htm;
    }

    #error_page  404              /404.html;

    # redirect server error pages to the static page /50x.html
    #
    error_page   500 502 503 504  /50x.html;
    location = /50x.html {
        root   /usr/share/nginx/html;
    }

    location /metrics {
      stub_status on;
      access_log off;
    }
}
設定ファイルをconfigmapにします。
ubuntu@k8s1:~$ kubectl create ns nginx
namespace/nginx created
ubuntu@k8s1:~$ kubectl create configmap default.conf --from-file=default.conf -n nginx
configmap/default.conf created
configmapをマウントするnginxをデプロイします。
NGINX Exporterはサイドカーで使うようです。
ubuntu@k8s1:~$ cat nginx.yaml
---
apiVersion: v1
kind: Service
metadata:
  labels:
    app: nginx
  name: nginx
  namespace: nginx
spec:
  ports:
  - port: 80
    protocol: TCP
    targetPort: 80
  selector:
    app: nginx
  type: LoadBalancer
---
apiVersion: apps/v1
kind: Deployment
metadata:
  labels:
    app: nginx
  name: nginx
  namespace: nginx
spec:
  replicas: 2
  selector:
    matchLabels:
      app: nginx
  template:
    metadata:
      labels:
        app: nginx
    spec:
      containers:
      - image: nginx
        name: nginx
        ports:
        - name: http
          containerPort: 80
          protocol: TCP
        volumeMounts:
        - mountPath: /etc/nginx/conf.d/
          name: nginx-default-conf
      - name: nginx-exporter
        image: nginx/nginx-prometheus-exporter:0.11.0
        ports:
        - name: metrics
          containerPort: 9113
          protocol: TCP
        args:
          - -nginx.scrape-uri=http://localhost:80/metrics
      volumes:
      - name: nginx-default-conf
        configMap:
          name: default.conf
          items:
          - key: default.conf
            path: default.conf
うまくいけば/metricsにアクセスすると以下のように表示されると思います。
ubuntu@k8s1:~$ kubectl get svc -n nginx
NAME    TYPE           CLUSTER-IP     EXTERNAL-IP     PORT(S)        AGE
nginx   LoadBalancer   10.43.120.90   192.168.0.230   80:32539/TCP   143m
ubuntu@k8s1:~$ curl http://192.168.0.230/metrics
Active connections: 2
server accepts handled requests
 4 4 146
Reading: 0 Writing: 1 Waiting: 1
exporterの方を叩くと以下のように表示されます。
ubuntu@k8s1:~$ kubectl get pod -n nginx -o wide
NAME                    READY   STATUS    RESTARTS   AGE    IP             NODE   NOMINATED NODE   READINESS GATES
nginx-6c5d67f76-slgzb   2/2     Running   0          150m   10.244.2.33    k8s3   <none>           <none>
nginx-6c5d67f76-vsb4v   2/2     Running   0          150m   10.244.1.107   k8s2   <none>           <none>
ubuntu@k8s1:~$ curl -s http://10.244.2.33:9113/metrics
# HELP nginx_connections_accepted Accepted client connections
# TYPE nginx_connections_accepted counter
nginx_connections_accepted 3
# HELP nginx_connections_active Active client connections
# TYPE nginx_connections_active gauge
nginx_connections_active 1
# HELP nginx_connections_handled Handled client connections
# TYPE nginx_connections_handled counter
nginx_connections_handled 3
# HELP nginx_connections_reading Connections where NGINX is reading the request header
# TYPE nginx_connections_reading gauge
nginx_connections_reading 0
# HELP nginx_connections_waiting Idle client connections
# TYPE nginx_connections_waiting gauge
nginx_connections_waiting 0
# HELP nginx_connections_writing Connections where NGINX is writing the response back to the client
# TYPE nginx_connections_writing gauge
nginx_connections_writing 1
# HELP nginx_http_requests_total Total http requests
# TYPE nginx_http_requests_total counter
nginx_http_requests_total 153
# HELP nginx_up Status of the last metric scrape
# TYPE nginx_up gauge
nginx_up 1
# HELP nginxexporter_build_info Exporter build information
# TYPE nginxexporter_build_info gauge
nginxexporter_build_info{arch="linux/arm64",commit="e4a6810d4f0b776f7fde37fea1d84e4c7284b72a",date="2022-09-07T21:09:51Z",dirty="false",go="go1.19",version="0.11.0"} 1
良さそうですね!
prometheusで取得します。
ポート番号9113はサービスに紐づけないのでPodMonitorにします。
apiVersion: monitoring.coreos.com/v1
kind: PodMonitor
metadata:
  name: nginx
  namespace: nginx
  labels:
    app: nginx
spec:
  selector:
    matchLabels:
      app: nginx
  podMetricsEndpoints:
  - port: metrics
RancherからPrometheus Graphを開いて確認します。
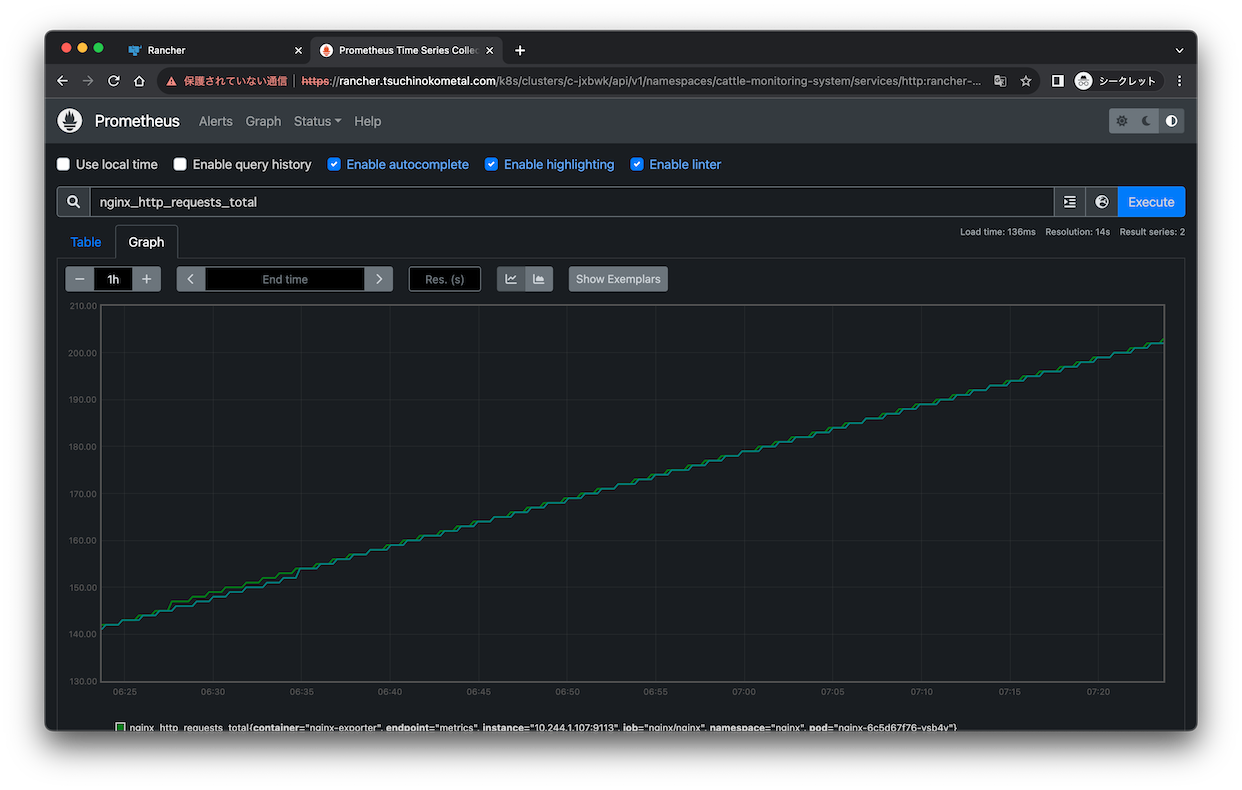
良さそうですね!
Prometheus Adapterを使う
Rancher Monitoringをインストールしているとすでにいると思います。
ubuntu@k8s1:~$ kubectl get pod -n cattle-monitoring-system --selector app.kubernetes.io/name=prometheus-adapter
NAME                                                     READY   STATUS    RESTARTS   AGE
rancher-monitoring-prometheus-adapter-6c4585d859-gghqd   1/1     Running   0          153m
デフォルトでルールも準備されています。
ubuntu@k8s1:~$ kubectl get cm rancher-monitoring-prometheus-adapter -n cattle-monitoring-system -o yaml
apiVersion: v1
data:
  config.yaml: |
    rules:
    - seriesQuery: '{__name__=~"^container_.*",container!="POD",namespace!="",pod!=""}'
      seriesFilters: []
      resources:
        overrides:
          namespace:
            resource: namespace
          pod:
            resource: pod
      name:
        matches: ^container_(.*)_seconds_total$
        as: ""
      metricsQuery: sum(rate(<<.Series>>{<<.LabelMatchers>>,container!="POD"}[5m]))
        by (<<.GroupBy>>)
    - seriesQuery: '{__name__=~"^container_.*",container!="POD",namespace!="",pod!=""}'
      seriesFilters:
      - isNot: ^container_.*_seconds_total$
      resources:
        overrides:
          namespace:
            resource: namespace
          pod:
            resource: pod
      name:
        matches: ^container_(.*)_total$
        as: ""
      metricsQuery: sum(rate(<<.Series>>{<<.LabelMatchers>>,container!="POD"}[5m]))
        by (<<.GroupBy>>)
    - seriesQuery: '{__name__=~"^container_.*",container!="POD",namespace!="",pod!=""}'
      seriesFilters:
      - isNot: ^container_.*_total$
      resources:
        overrides:
          namespace:
            resource: namespace
          pod:
            resource: pod
      name:
        matches: ^container_(.*)$
        as: ""
      metricsQuery: sum(<<.Series>>{<<.LabelMatchers>>,container!="POD"}) by (<<.GroupBy>>)
    - seriesQuery: '{namespace!="",__name__!~"^container_.*"}'
      seriesFilters:
      - isNot: .*_total$
      resources:
        template: <<.Resource>>
      name:
        matches: ""
        as: ""
      metricsQuery: sum(<<.Series>>{<<.LabelMatchers>>}) by (<<.GroupBy>>)
    - seriesQuery: '{namespace!="",__name__!~"^container_.*"}'
      seriesFilters:
      - isNot: .*_seconds_total
      resources:
        template: <<.Resource>>
      name:
        matches: ^(.*)_total$
        as: ""
      metricsQuery: sum(rate(<<.Series>>{<<.LabelMatchers>>}[5m])) by (<<.GroupBy>>)
    - seriesQuery: '{namespace!="",__name__!~"^container_.*"}'
      seriesFilters: []
      resources:
        template: <<.Resource>>
      name:
        matches: ^(.*)_seconds_total$
        as: ""
      metricsQuery: sum(rate(<<.Series>>{<<.LabelMatchers>>}[5m])) by (<<.GroupBy>>)
kind: ConfigMap
metadata:
  annotations:
    meta.helm.sh/release-name: rancher-monitoring
    meta.helm.sh/release-namespace: cattle-monitoring-system
  creationTimestamp: "2023-08-05T09:45:19Z"
  labels:
    app.kubernetes.io/component: metrics
    app.kubernetes.io/instance: rancher-monitoring
    app.kubernetes.io/managed-by: Helm
    app.kubernetes.io/name: prometheus-adapter
    app.kubernetes.io/part-of: prometheus-adapter
    app.kubernetes.io/version: v0.10.0
    helm.sh/chart: prometheus-adapter-3.4.0
  name: rancher-monitoring-prometheus-adapter
  namespace: cattle-monitoring-system
  resourceVersion: "7306263"
  uid: 2fea8ba4-06bb-41de-905b-246e34ffcf63
カスタムメトリクスを確認します。
ubuntu@k8s1:~$ kubectl get --raw /apis/custom.metrics.k8s.io/v1beta1 | jq '.resources[].name' | wc -l
6290
めちゃくちゃありますやん。
多すぎるのでNGINXだけ取り出すルールにしてみます。
  rules:
    default: false
    custom:
      - seriesQuery: '{__name__=~"^nginx_.*"}'
        seriesFilters:
          - isNot: .*ingress_controller.*
        resources:
          overrides:
            namespace:
              resource: namespace
            pod:
              resource: pod
        name:
          matches: ''
          as: ''
        metricsQuery: <<.Series>>{<<.LabelMatchers>>}
まず、デフォルトのルールは不要なのでdefaultをfalseにします。
ルールの書き方についてはこちら
で詳しく説明してくれています。
seriesQueryで"nginx_“から始まるメトリクスを取得します。
NGINX ingress controllerが含まれてしまうので、seriesFiltersで除外します。
名前はそのままで、クエリも単純にnamespaceとpodだけ上書きされる形です。
上記ルールをRancher GUIでMonitoringインストール時にいじれるyamlに追記します。
Edit YAMLの差分は以下。
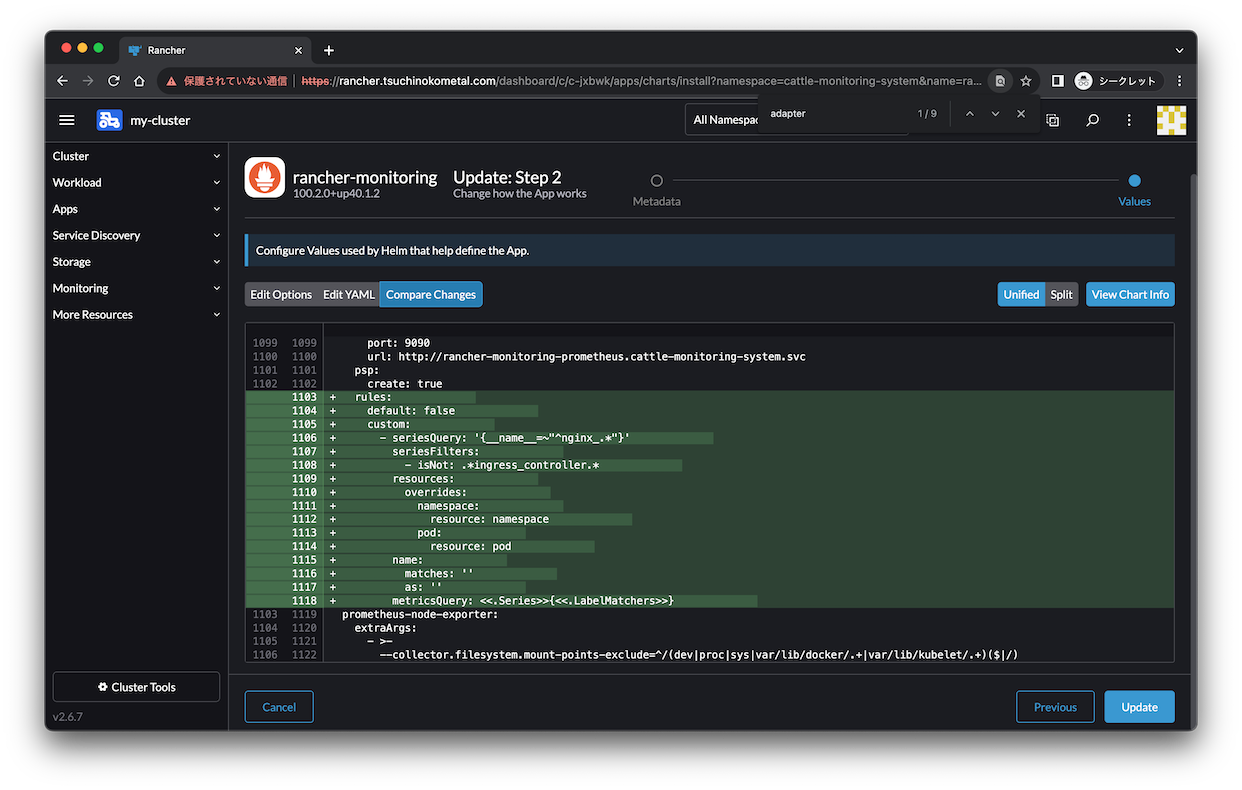
デプロイが成功すると設定ファイルは以下のようになりました。
ubuntu@k8s1:~$ kubectl get cm rancher-monitoring-prometheus-adapter -n cattle-monitoring-system -o yaml
apiVersion: v1
data:
  config.yaml: |
    rules:
    - metricsQuery: <<.Series>>{<<.LabelMatchers>>}
      name:
        as: ""
        matches: ""
      resources:
        overrides:
          namespace:
            resource: namespace
          pod:
            resource: pod
      seriesFilters:
      - isNot: .*ingress_controller.*
      seriesQuery: '{__name__=~"^nginx_.*"}'
kind: ConfigMap
metadata:
  annotations:
    meta.helm.sh/release-name: rancher-monitoring
    meta.helm.sh/release-namespace: cattle-monitoring-system
  creationTimestamp: "2023-08-05T09:45:19Z"
  labels:
    app.kubernetes.io/component: metrics
    app.kubernetes.io/instance: rancher-monitoring
    app.kubernetes.io/managed-by: Helm
    app.kubernetes.io/name: prometheus-adapter
    app.kubernetes.io/part-of: prometheus-adapter
    app.kubernetes.io/version: v0.10.0
    helm.sh/chart: prometheus-adapter-3.4.0
  name: rancher-monitoring-prometheus-adapter
  namespace: cattle-monitoring-system
  resourceVersion: "7392951"
  uid: 2fea8ba4-06bb-41de-905b-246e34ffcf63
メトリクスを確認してみます。
ubuntu@k8s1:~$ kubectl get --raw /apis/custom.metrics.k8s.io/v1beta1 | jq
{
  "kind": "APIResourceList",
  "apiVersion": "v1",
  "groupVersion": "custom.metrics.k8s.io/v1beta1",
  "resources": [
    {
      "name": "namespaces/nginx_connections_handled",
      "singularName": "",
      "namespaced": false,
      "kind": "MetricValueList",
      "verbs": [
        "get"
      ]
    },
    {
      "name": "namespaces/nginx_connections_waiting",
      "singularName": "",
      "namespaced": false,
      "kind": "MetricValueList",
      "verbs": [
        "get"
      ]
    },
    {
      "name": "pods/nginx_connections_writing",
      "singularName": "",
      "namespaced": true,
      "kind": "MetricValueList",
      "verbs": [
        "get"
      ]
    },
    {
      "name": "namespaces/nginx_connections_accepted",
      "singularName": "",
      "namespaced": false,
      "kind": "MetricValueList",
      "verbs": [
        "get"
      ]
    },
    {
      "name": "pods/nginx_connections_accepted",
      "singularName": "",
      "namespaced": true,
      "kind": "MetricValueList",
      "verbs": [
        "get"
      ]
    },
    {
      "name": "pods/nginx_connections_active",
      "singularName": "",
      "namespaced": true,
      "kind": "MetricValueList",
      "verbs": [
        "get"
      ]
    },
    {
      "name": "namespaces/nginx_connections_reading",
      "singularName": "",
      "namespaced": false,
      "kind": "MetricValueList",
      "verbs": [
        "get"
      ]
    },
    {
      "name": "namespaces/nginx_http_requests_total",
      "singularName": "",
      "namespaced": false,
      "kind": "MetricValueList",
      "verbs": [
        "get"
      ]
    },
    {
      "name": "pods/nginx_http_requests_total",
      "singularName": "",
      "namespaced": true,
      "kind": "MetricValueList",
      "verbs": [
        "get"
      ]
    },
    {
      "name": "namespaces/nginx_up",
      "singularName": "",
      "namespaced": false,
      "kind": "MetricValueList",
      "verbs": [
        "get"
      ]
    },
    {
      "name": "pods/nginx_up",
      "singularName": "",
      "namespaced": true,
      "kind": "MetricValueList",
      "verbs": [
        "get"
      ]
    },
    {
      "name": "namespaces/nginx_connections_active",
      "singularName": "",
      "namespaced": false,
      "kind": "MetricValueList",
      "verbs": [
        "get"
      ]
    },
    {
      "name": "pods/nginx_connections_handled",
      "singularName": "",
      "namespaced": true,
      "kind": "MetricValueList",
      "verbs": [
        "get"
      ]
    },
    {
      "name": "pods/nginx_connections_reading",
      "singularName": "",
      "namespaced": true,
      "kind": "MetricValueList",
      "verbs": [
        "get"
      ]
    },
    {
      "name": "pods/nginx_connections_waiting",
      "singularName": "",
      "namespaced": true,
      "kind": "MetricValueList",
      "verbs": [
        "get"
      ]
    },
    {
      "name": "namespaces/nginx_connections_writing",
      "singularName": "",
      "namespaced": false,
      "kind": "MetricValueList",
      "verbs": [
        "get"
      ]
    }
  ]
}
nginxだけ取得できていますね。
値も取得してみます。
ubuntu@k8s1:~$ kubectl get --raw /apis/custom.metrics.k8s.io/v1beta1/namespaces/nginx/pods/*/nginx_http_requests_total | jq
{
  "kind": "MetricValueList",
  "apiVersion": "custom.metrics.k8s.io/v1beta1",
  "metadata": {},
  "items": [
    {
      "describedObject": {
        "kind": "Pod",
        "namespace": "nginx",
        "name": "nginx-6c5d67f76-slgzb",
        "apiVersion": "/v1"
      },
      "metricName": "nginx_http_requests_total",
      "timestamp": "2023-08-12T11:01:27Z",
      "value": "420",
      "selector": null
    },
    {
      "describedObject": {
        "kind": "Pod",
        "namespace": "nginx",
        "name": "nginx-6c5d67f76-vsb4v",
        "apiVersion": "/v1"
      },
      "metricName": "nginx_http_requests_total",
      "timestamp": "2023-08-12T11:01:27Z",
      "value": "420",
      "selector": null
    }
  ]
}
valueに値が入っています。良さそうですね!
HPAでカスタムメトリクスを使う
HPAは以下のようにしました。
apiVersion: autoscaling/v2
kind: HorizontalPodAutoscaler
metadata:
  name: nginx
  namespace: nginx
spec:
  scaleTargetRef:
    apiVersion: apps/v1
    kind: Deployment
    name: nginx
  minReplicas: 1
  maxReplicas: 4
  metrics:
  - type: Pods
    pods:
      metric:
        name: nginx_connections_active
      target:
        type: AverageValue
        averageValue: 10
確認します。
ubuntu@k8s1:~$ kubectl get hpa -n nginx
NAME    REFERENCE          TARGETS   MINPODS   MAXPODS   REPLICAS   AGE
nginx   Deployment/nginx   1/10      1         4         2          42s

ubuntu@k8s1:~$ kubectl describe hpa -n nginx
Warning: autoscaling/v2beta2 HorizontalPodAutoscaler is deprecated in v1.23+, unavailable in v1.26+; use autoscaling/v2 HorizontalPodAutoscaler
Name:                                  nginx
Namespace:                             nginx
Labels:                                <none>
Annotations:                           <none>
CreationTimestamp:                     Sat, 12 Aug 2023 21:51:00 +0900
Reference:                             Deployment/nginx
Metrics:                               ( current / target )
  "nginx_connections_active" on pods:  1 / 10
Min replicas:                          1
Max replicas:                          4
Deployment pods:                       2 current / 2 desired
Conditions:
  Type            Status  Reason               Message
  ----            ------  ------               -------
  AbleToScale     True    ScaleDownStabilized  recent recommendations were higher than current one, applying the highest recent recommendation
  ScalingActive   True    ValidMetricFound     the HPA was able to successfully calculate a replica count from pods metric nginx_connections_active
  ScalingLimited  False   DesiredWithinRange   the desired count is within the acceptable range
Events:           <none>
値が取れているので良さそうですね!
これでアクティブ接続数に応じてスケールできそうですが、最大接続数が出ないのは残念ですね。
それがあれば割合を出すクエリにするんですが。