Cloud MonitoringでGKE上のPayara JMX Mbeansメトリクスを取得する
訳あってマネージドPrometheusなしでPayaraのJMX Mbeansのメトリクス取得を実装するハメになったので
ワークロード指標
でのやり方を試してみました。
ここで紹介しているやり方はGKE1.24以降は使えないと書いてあるのでマネージドPrometheusを使った方がいいです。
※追記
マネージドPrometheusへの移行
も書きました。
Payaraイメージ作成
まずDocker hubにあるイメージそのままでコンテナを起動してみます。
% docker run -d -p 4848:4848 -p 8080:8080 --name=payara-test payara/server-full:5.2022.5
% curl -s http://localhost:8080/metrics | grep -v ^#
base_classloader_loadedClasses_count 17960
base_classloader_loadedClasses_total_total 17962
base_classloader_unloadedClasses_total_total 2
base_cpu_availableProcessors 2
base_cpu_systemLoadAverage 0.56
base_gc_time_total{name="PS MarkSweep"} 3358
base_gc_time_total{name="PS Scavenge"} 1447
base_gc_total_total{name="PS Scavenge"} 21
base_gc_total_total{name="PS MarkSweep"} 4
base_jvm_uptime_seconds 214.435
base_memory_committedHeap_bytes 5.33200896E8
base_memory_committedNonHeap_bytes 1.52502272E8
base_memory_maxHeap_bytes 2.566914048E9
base_memory_maxNonHeap_bytes -1
base_memory_usedHeap_bytes 1.23817416E8
base_memory_usedNonHeap_bytes 1.34202096E8
base_thread_count 138
base_thread_daemon_count 123
base_thread_max_count 140
vendor_system_cpu_load 0.05405405405405406
% curl -s http://localhost:8080/metrics | grep -v ^# | wc -l
      20
どうやらデフォルトで20種類のメトリクスは取得できるようですね。
せっかくですのでこちら
を参考にJMX Mbeansメトリクスを追加で取得してみます。
JMX Bean Monitoringをコマンドで有効化します。
初期ユーザー名とパスワードはadmin/adminです。
毎回入力するのめんどくさい。
% docker exec -it payara-test asadmin set configs.config.server-config.amx-configuration.enabled=true
Do you trust the above certificate [y|N] -->y
Enter admin user name> admin
Enter admin password for user "admin">
configs.config.server-config.amx-configuration.enabled=true
Command set executed successfully.
% docker exec -it payara-test asadmin set configs.config.server-config.monitoring-service.module-monitoring-levels.jdbc-connection-pool=HIGH
Enter admin user name> admin
Enter admin password for user "admin">
configs.config.server-config.monitoring-service.module-monitoring-levels.jdbc-connection-pool=HIGH
Command set executed successfully.
% docker exec -it payara-test asadmin set configs.config.server-config.monitoring-service.module-monitoring-levels.http-service=HIGH
Enter admin user name> admin
Enter admin password for user "admin">
configs.config.server-config.monitoring-service.module-monitoring-levels.http-service=HIGH
Command set executed successfully.
次にmetrics.xmlを作成してコンテナに追加します。
内容はこちら
のコピペですが、
こちら
も参考にしてみてください。
% vi metrics.xml
% cat metrics.xml
<?xml version="1.0" encoding="UTF-8"?>
<config>
    <vendor>
        <metadata>
            <name>jdbc.connection.pool.%sPool.numconnfree</name>
            <mbean>amx:pp=/mon/server-mon[server],type=jdbc-connection-pool-mon,name=resources/%sPool/numconnfree#current</mbean>
            <type>counter</type>
            <unit>none</unit>
            <displayName>numconnfreePool</displayName>
            <description>The total number of free connections in the pool as of the last sampling.</description>
        </metadata>
        <metadata>
            <name>http.connection.queue.%s.numconnopen</name>
            <mbean>amx:pp=/mon/server-mon[server],type=connection-queue-mon,name=network/http-%s/connection-queue/countopenconnections#count</mbean>
            <type>gauge</type>
            <unit>none</unit>
            <displayName>numconnopenPool</displayName>
            <description>The number of open/active connections</description>
        </metadata>
        <metadata>
            <name>http.connection.pool.%s.numconn</name>
            <mbean>amx:pp=/mon/server-mon[server],type=connection-queue-mon,name=network/http-%s/connection-queue/counttotalqueued#count</mbean>
            <type>gauge</type>
            <unit>none</unit>
            <displayName>numconncountPool</displayName>
            <description>Number of http connections handled</description>
        </metadata>
        <metadata>
            <name>http.connection.queue.http.numconnopen</name>
            <mbean>amx:pp=/mon/server-mon[server],type=connection-queue-mon,name=network//connection-queue/countopenconnections#count</mbean>
            <type>gauge</type>
            <unit>none</unit>
            <displayName>numconnopenPool</displayName>
            <description>The number of open/active http connections</description>
        </metadata>
        <metadata>
            <name>http.connection.pool.http.numconn</name>
            <mbean>amx:pp=/mon/server-mon[server],type=connection-queue-mon,name=network//connection-queue/counttotalqueued#count</mbean>
            <type>gauge</type>
            <unit>none</unit>
            <displayName>numconncountPool</displayName>
            <description>Total Number of connections handled</description>
        </metadata>
    </vendor>
</config>
% docker cp metrics.xml payara-test:/opt/payara/appserver/glassfish/domains/domain1/config/
再起動して反映させます。
6個メトリクスが増えてますね!
% docker restart payara-test
% curl -s http://localhost:8080/metrics | grep -v ^#
base_classloader_loadedClasses_count 17695
base_classloader_loadedClasses_total_total 17697
base_classloader_unloadedClasses_total_total 1
base_cpu_availableProcessors 2
base_cpu_systemLoadAverage 0.75
base_gc_time_total{name="PS MarkSweep"} 1171
base_gc_time_total{name="PS Scavenge"} 674
base_gc_total_total{name="PS Scavenge"} 18
base_gc_total_total{name="PS MarkSweep"} 4
base_jvm_uptime_seconds 40.896
base_memory_committedHeap_bytes 6.74758656E8
base_memory_committedNonHeap_bytes 1.49184512E8
base_memory_maxHeap_bytes 2.566914048E9
base_memory_maxNonHeap_bytes -1
base_memory_usedHeap_bytes 2.67076736E8
base_memory_usedNonHeap_bytes 1.30000056E8
base_thread_count 134
base_thread_daemon_count 118
base_thread_max_count 136
vendor_http_connection_pool_http_numconn 3
vendor_http_connection_pool_network_http_listener_1_connection_queue_numconn 1
vendor_http_connection_pool_network_http_listener_2_connection_queue_numconn 0
vendor_http_connection_queue_http_numconnopen 1
vendor_http_connection_queue_network_http_listener_1_connection_queue_numconnopen 1
vendor_http_connection_queue_network_http_listener_2_connection_queue_numconnopen 0
vendor_system_cpu_load 0.4576271186440678
% curl -s http://localhost:8080/metrics | grep -v ^# | wc -l
      26
良さそうなのでこれをGKEにデプロイしてみます。
他のメトリクスを追加したい場合はこちら を参考にしていただくと良いと思います。
GKEにデプロイする
GKEクラスターは以下の設定で構築しました。
ノードはDockerベースのcosです。
% gcloud container clusters list
NAME       LOCATION           MASTER_VERSION    MASTER_IP       MACHINE_TYPE  NODE_VERSION      NUM_NODES  STATUS
cluster-1  asia-northeast1-a  1.21.14-gke.8500  x.x.x.x         e2-medium     1.21.14-gke.8500  1          RUNNING
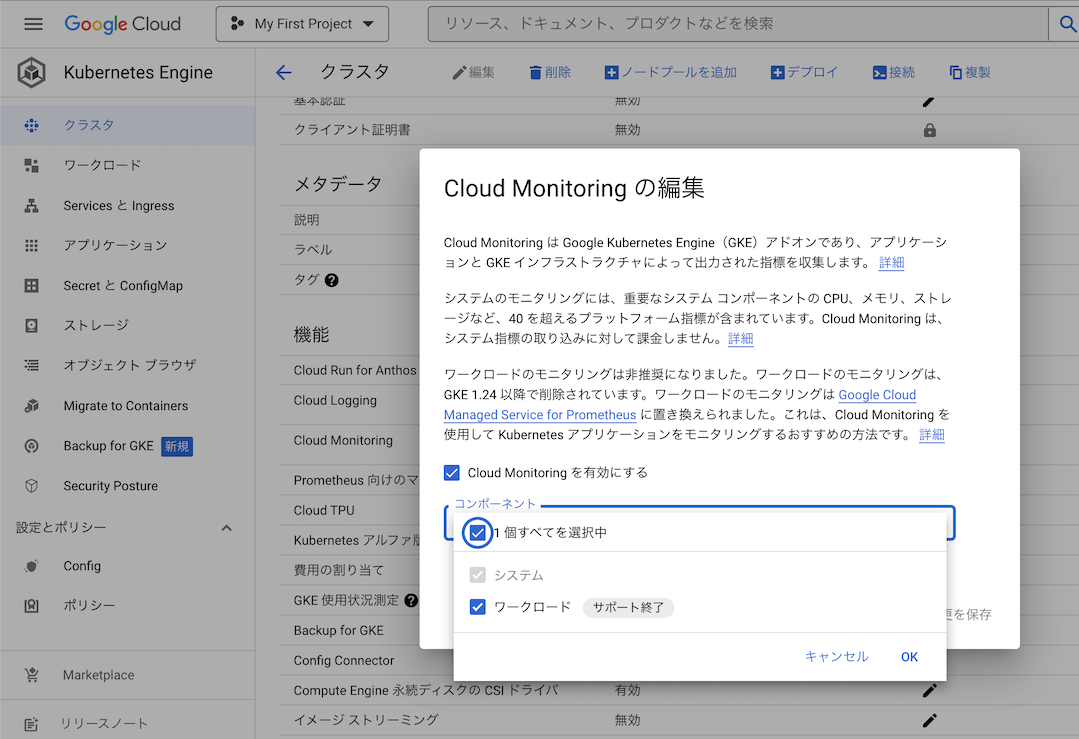
メトリクスを取得するには以下の図のようにワークロード指標を有効化する必要があります。
公式ドキュメント
をご確認ください。
書いてあるとおり非推奨です。マネージドPrometheusを使いましょう。
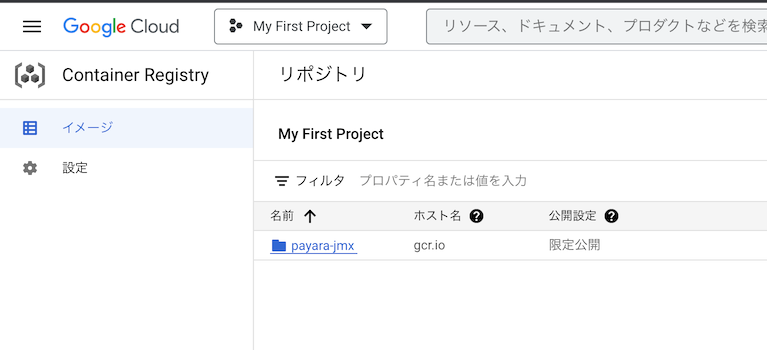
イメージをコミットしてGCPのConainer Registryにプッシュします。
Project IDはご自身の環境に書き換えてください。
% docker commit payara-test payara-customized
% docker tag payara-customized gcr.io/[Project ID]/payara-jmx:v1
% gcloud auth configure-docker
...
Docker configuration file updated.
% docker images
REPOSITORY                                 TAG        IMAGE ID       CREATED        SIZE
payara-customized                          latest     cd875cc2b619   15 hours ago   595MB
gcr.io/[Project ID]/payara-jmx             v1         cd875cc2b619   15 hours ago   595MB
payara/server-full                         5.2022.5   534ef843a46e   11 days ago    485MB
% docker push gcr.io/[Project ID]/payara-jmx:v1
プッシュできていたら以下のようになると思います。
Payara Podをデプロイします。
プラグインのインストールが必要でした。
% gcloud container clusters get-credentials cluster-1
Fetching cluster endpoint and auth data.
CRITICAL: ACTION REQUIRED: gke-gcloud-auth-plugin, which is needed for continued use of kubectl, was not found or is not executable. Install gke-gcloud-auth-plugin for use with kubectl by following https://cloud.google.com/blog/products/containers-kubernetes/kubectl-auth-changes-in-gke
kubeconfig entry generated for cluster-1.
% gcloud components install gke-gcloud-auth-plugin


Your current Google Cloud CLI version is: 412.0.0
Installing components from version: 412.0.0

┌────────────────────────────────────────────┐
│    These components will be installed.     │
├────────────────────────┬─────────┬─────────┤
│          Name          │ Version │   Size  │
├────────────────────────┼─────────┼─────────┤
│ gke-gcloud-auth-plugin │   0.4.0 │ 7.5 MiB │
└────────────────────────┴─────────┴─────────┘

For the latest full release notes, please visit:
  https://cloud.google.com/sdk/release_notes

Do you want to continue (Y/n)?  Y

╔════════════════════════════════════════════════════════════╗
╠═ Creating update staging area                             ═╣
╠════════════════════════════════════════════════════════════╣
╠═ Installing: gke-gcloud-auth-plugin                       ═╣
╠════════════════════════════════════════════════════════════╣
╠═ Installing: gke-gcloud-auth-plugin                       ═╣
╠════════════════════════════════════════════════════════════╣
╠═ Creating backup and activating new installation          ═╣
╚════════════════════════════════════════════════════════════╝

Performing post processing steps...done.

Update done!

% gcloud container clusters get-credentials cluster-1
Fetching cluster endpoint and auth data.
kubeconfig entry generated for cluster-1.
% kubectl create deployment payara --image=gcr.io/[Project ID]/payara-jmx:v1 --port=8080 --replicas=3 -o yaml --dry_run=client > deploy.yaml
ポートの名前を設定しておいてください。
その情報は後述するpodMonitorで指定します。
Payaraは8080ポートで取れるようなのでそこにhttpという名前をつけました。
% vi deploy.yaml
% cat deploy.yaml
apiVersion: apps/v1
kind: Deployment
metadata:
  creationTimestamp: null
  labels:
    app: payara
  name: payara
spec:
  replicas: 3
  selector:
    matchLabels:
      app: payara
  strategy: {}
  template:
    metadata:
      creationTimestamp: null
      labels:
        app: payara
    spec:
      containers:
      - image: gcr.io/[Project ID]/payara-jmx:v1
        name: payara-jmx
        ports:
        - name: http
          containerPort: 8080
        resources: {}
status: {}
% kubectl apply -f deploy.yaml
PodMonitorをデプロイします。
selectorも間違えないようにご注意ください。
% cat payara-monitor.yaml
apiVersion: monitoring.gke.io/v1alpha1
kind: PodMonitor
metadata:
  name: payara-monitor
  namespace: default
spec:
  selector:
    matchLabels:
      app: payara
  podMetricsEndpoints:
  - port: http
    path: /metrics
% kubectl apply -f payara-monitor.yaml
メトリクスが収集できているかどうかの確認方法は ドキュメント があります。
% kubectl get pod -l app=payara
W1225 12:32:11.935786    6759 gcp.go:119] WARNING: the gcp auth plugin is deprecated in v1.22+, unavailable in v1.26+; use gcloud instead.
To learn more, consult https://cloud.google.com/blog/products/containers-kubernetes/kubectl-auth-changes-in-gke
NAME                      READY   STATUS    RESTARTS   AGE
payara-57c487447b-d2542   1/1     Running   0          2m52s
payara-57c487447b-d2zsc   1/1     Running   0          2m52s
payara-57c487447b-qx9lq   1/1     Running   0          2m52s
% POD_NAME=payara-57c487447b-d2542
% echo $POD_NAME
payara-689d776cd4-mr2qn
% NAMESPACE=default
% PORT_NUMBER=8080
% METRICS_PATH=/metrics
% kubectl get --raw /api/v1/namespaces/$NAMESPACE/pods/$POD_NAME:$PORT_NUMBER/proxy/$METRICS_PATH
W1225 12:33:30.626557    6855 gcp.go:119] WARNING: the gcp auth plugin is deprecated in v1.22+, unavailable in v1.26+; use gcloud instead.
To learn more, consult https://cloud.google.com/blog/products/containers-kubernetes/kubectl-auth-changes-in-gke
# TYPE base_classloader_loadedClasses_count gauge
# HELP base_classloader_loadedClasses_count Displays the number of classes that are currently loaded in the JVM.
base_classloader_loadedClasses_count 17841
# TYPE base_classloader_loadedClasses_total_total counter
# HELP base_classloader_loadedClasses_total_total Displays the total number of classes that have been loaded since the JVM has started execution.
base_classloader_loadedClasses_total_total 17843
# TYPE base_classloader_unloadedClasses_total_total counter
# HELP base_classloader_unloadedClasses_total_total Displays the total number of classes unloaded since the JVM has started execution.
base_classloader_unloadedClasses_total_total 2
# TYPE base_cpu_availableProcessors gauge
# HELP base_cpu_availableProcessors Displays the number of processors available to the JVM. This value may change during a particular invocation of the virtual machine.
base_cpu_availableProcessors 1
# TYPE base_cpu_systemLoadAverage gauge
# HELP base_cpu_systemLoadAverage Displays the system load average for the last minute. The system load average is the sum of the number of runnable entities queued to the available processors and the number of runnable entities running on the available processors averaged over a period of time. The way in which the load average is calculated is operating system specific but is typically a damped time-dependent average. If the load average is not available, a negative value is displayed. This attribute is designed to provide a hint about the system load and may be queried frequently. The load average may be unavailable on some platforms where it is expensive to implement this method.
base_cpu_systemLoadAverage 1.96
# TYPE base_gc_time_total counter
# HELP base_gc_time_total Displays the approximate accumulated collection elapsed time in milliseconds. This attribute displays -1 if the collection elapsed time is undefined for this collector. The JVM implementation may use a high resolution timer to measure the elapsed time. This attribute may display the same value even if the collection count has been incremented if the collection elapsed time is very short.
base_gc_time_total{name="MarkSweepCompact"} 4277
base_gc_time_total{name="Copy"} 6893
# TYPE base_gc_total_total counter
# HELP base_gc_total_total Displays the total number of collections that have occurred. This attribute lists -1 if the collection count is undefined for this collector.
base_gc_total_total{name="MarkSweepCompact"} 6
base_gc_total_total{name="Copy"} 83
# TYPE base_jvm_uptime_seconds gauge
# HELP base_jvm_uptime_seconds Displays the uptime of the JVM in milliseconds.
base_jvm_uptime_seconds 222.842
# TYPE base_memory_committedHeap_bytes gauge
# HELP base_memory_committedHeap_bytes Displays the amount of memory in bytes that is committed for the JVM to use.
base_memory_committedHeap_bytes 2.23911936E8
# TYPE base_memory_committedNonHeap_bytes gauge
# HELP base_memory_committedNonHeap_bytes Displays the amount of memory in bytes that is committed for the JVM to use.
base_memory_committedNonHeap_bytes 1.50102016E8
# TYPE base_memory_maxHeap_bytes gauge
# HELP base_memory_maxHeap_bytes Displays the maximum amount of memory in bytes that can be used for HeapMemory.
base_memory_maxHeap_bytes 2.067791872E9
# TYPE base_memory_maxNonHeap_bytes gauge
# HELP base_memory_maxNonHeap_bytes Displays the maximum amount of memory in bytes that can be used for NonHeapMemory.
base_memory_maxNonHeap_bytes -1
# TYPE base_memory_usedHeap_bytes gauge
# HELP base_memory_usedHeap_bytes Displays the amount of used memory in bytes.
base_memory_usedHeap_bytes 1.39016848E8
# TYPE base_memory_usedNonHeap_bytes gauge
# HELP base_memory_usedNonHeap_bytes Displays the amount of used memory in bytes.
base_memory_usedNonHeap_bytes 1.31147576E8
# TYPE base_thread_count gauge
# HELP base_thread_count Displays the current number of live threads including both daemon and non-daemon threads.
base_thread_count 108
# TYPE base_thread_daemon_count gauge
# HELP base_thread_daemon_count Displays the current number of live daemon threads.
base_thread_daemon_count 95
# TYPE base_thread_max_count gauge
# HELP base_thread_max_count Displays the peak live thread count since the Java virtual machine started or peak was reset. This includes daemon and non-daemon threads.
base_thread_max_count 133
# TYPE vendor_http_connection_pool_http_numconn gauge
# HELP vendor_http_connection_pool_http_numconn Total Number of connections handled
vendor_http_connection_pool_http_numconn 7
# TYPE vendor_http_connection_pool_network_http_listener_1_connection_queue_numconn gauge
# HELP vendor_http_connection_pool_network_http_listener_1_connection_queue_numconn Number of http connections handled
vendor_http_connection_pool_network_http_listener_1_connection_queue_numconn 5
# TYPE vendor_http_connection_pool_network_http_listener_2_connection_queue_numconn gauge
# HELP vendor_http_connection_pool_network_http_listener_2_connection_queue_numconn Number of http connections handled
vendor_http_connection_pool_network_http_listener_2_connection_queue_numconn 0
# TYPE vendor_http_connection_queue_http_numconnopen gauge
# HELP vendor_http_connection_queue_http_numconnopen The number of open/active http connections
vendor_http_connection_queue_http_numconnopen 2
# TYPE vendor_http_connection_queue_network_http_listener_1_connection_queue_numconnopen gauge
# HELP vendor_http_connection_queue_network_http_listener_1_connection_queue_numconnopen The number of open/active connections
vendor_http_connection_queue_network_http_listener_1_connection_queue_numconnopen 2
# TYPE vendor_http_connection_queue_network_http_listener_2_connection_queue_numconnopen gauge
# HELP vendor_http_connection_queue_network_http_listener_2_connection_queue_numconnopen The number of open/active connections
vendor_http_connection_queue_network_http_listener_2_connection_queue_numconnopen 0
# TYPE vendor_system_cpu_load gauge
# HELP vendor_system_cpu_load Display the "recent cpu usage" for the whole system. This value is a double in the [0.0,1.0] interval. A value of 0.0 means that all CPUs were idle during the recent period of time observed, while a value of 1.0 means that all CPUs were actively running 100% of the time during the recent period being observed. All values between 0.0 and 1.0 are possible depending of the activities going on in the system. If the system recent cpu usage is not available, the method returns a negative value.
vendor_system_cpu_load 0.24188465
% kubectl get --raw /api/v1/namespaces/$NAMESPACE/pods/$POD_NAME:$PORT_NUMBER/proxy/$METRICS_PATH | grep -v ^#
W1225 12:34:53.377745    7050 gcp.go:119] WARNING: the gcp auth plugin is deprecated in v1.22+, unavailable in v1.26+; use gcloud instead.
To learn more, consult https://cloud.google.com/blog/products/containers-kubernetes/kubectl-auth-changes-in-gke
base_classloader_loadedClasses_count 17845
base_classloader_loadedClasses_total_total 17847
base_classloader_unloadedClasses_total_total 2
base_cpu_availableProcessors 1
base_cpu_systemLoadAverage 0.75
base_gc_time_total{name="MarkSweepCompact"} 4277
base_gc_time_total{name="Copy"} 6913
base_gc_total_total{name="MarkSweepCompact"} 6
base_gc_total_total{name="Copy"} 84
base_jvm_uptime_seconds 305.444
base_memory_committedHeap_bytes 2.23911936E8
base_memory_committedNonHeap_bytes 1.50495232E8
base_memory_maxHeap_bytes 2.067791872E9
base_memory_maxNonHeap_bytes -1
base_memory_usedHeap_bytes 1.68358632E8
base_memory_usedNonHeap_bytes 1.31571024E8
base_thread_count 108
base_thread_daemon_count 95
base_thread_max_count 133
vendor_http_connection_pool_http_numconn 10
vendor_http_connection_pool_network_http_listener_1_connection_queue_numconn 8
vendor_http_connection_pool_network_http_listener_2_connection_queue_numconn 0
vendor_http_connection_queue_http_numconnopen 1
vendor_http_connection_queue_network_http_listener_1_connection_queue_numconnopen 1
vendor_http_connection_queue_network_http_listener_2_connection_queue_numconnopen 0
vendor_system_cpu_load 0.05689192328767123
% kubectl get --raw /api/v1/namespaces/$NAMESPACE/pods/$POD_NAME:$PORT_NUMBER/proxy/$METRICS_PATH | grep -v ^# | wc -l
W1225 12:34:48.495936    7031 gcp.go:119] WARNING: the gcp auth plugin is deprecated in v1.22+, unavailable in v1.26+; use gcloud instead.
To learn more, consult https://cloud.google.com/blog/products/containers-kubernetes/kubectl-auth-changes-in-gke
      26
GKE上でもPayaraメトリクスは取得できそうです。
PodMonitorの詳細はこんな感じ。
ドキュメントによるとConditionsがReadyでTrueならいいのかな?
% kubectl describe podmonitor.monitoring.gke.io payara-monitor
W1225 12:36:29.424699    7222 gcp.go:119] WARNING: the gcp auth plugin is deprecated in v1.22+, unavailable in v1.26+; use gcloud instead.
To learn more, consult https://cloud.google.com/blog/products/containers-kubernetes/kubectl-auth-changes-in-gke
Name:         payara-monitor
Namespace:    default
Labels:       <none>
Annotations:  <none>
API Version:  monitoring.gke.io/v1alpha1
Kind:         PodMonitor
Metadata:
  Creation Timestamp:  2022-12-25T03:30:55Z
  Generation:          1
  Managed Fields:
    API Version:  monitoring.gke.io/v1alpha1
    Fields Type:  FieldsV1
    fieldsV1:
      f:metadata:
        f:annotations:
          .:
          f:kubectl.kubernetes.io/last-applied-configuration:
      f:spec:
        .:
        f:podMetricsEndpoints:
        f:selector:
          .:
          f:matchLabels:
            .:
            f:app:
    Manager:      kubectl-client-side-apply
    Operation:    Update
    Time:         2022-12-25T03:30:55Z
    API Version:  monitoring.gke.io/v1alpha1
    Fields Type:  FieldsV1
    fieldsV1:
      f:status:
        .:
        f:conditions:
          .:
          k:{"type":"Ready"}:
            .:
            f:lastTransitionTime:
            f:message:
            f:observedGeneration:
            f:reason:
            f:status:
            f:type:
        f:generatedConfigMap:
          .:
          f:apiVersion:
          f:kind:
          f:name:
          f:namespace:
          f:resourceVersion:
          f:uid:
    Manager:         manager
    Operation:       Update
    Time:            2022-12-25T03:30:55Z
  Resource Version:  30748
  UID:               8d2781b3-d950-4fbc-8358-a40d54bb8e26
Spec:
  Pod Metrics Endpoints:
    Path:  /metrics
    Port:  http
  Selector:
    Match Labels:
      App:  payara
Status:
  Conditions:
    Last Transition Time:  2022-12-25T03:30:55Z
    Message:
    Observed Generation:   1
    Reason:                ConfigMapPresent
    Status:                True
    Type:                  Ready
  Generated Config Map:
    API Version:       v1
    Kind:              ConfigMap
    Name:              payara-monitor-thvqz
    Namespace:         default
    Resource Version:  30747
    UID:               b4ccd236-bfa1-4246-831d-2cb7989b4c2b
Events:
  Type    Reason            Age    From                   Message
  ----    ------            ----   ----                   -------
  Normal  CreatedConfigMap  5m35s  podmonitor-controller  created configmap "payara-monitor-thvqz"
Metrics Explorerでメトリクスを表示する
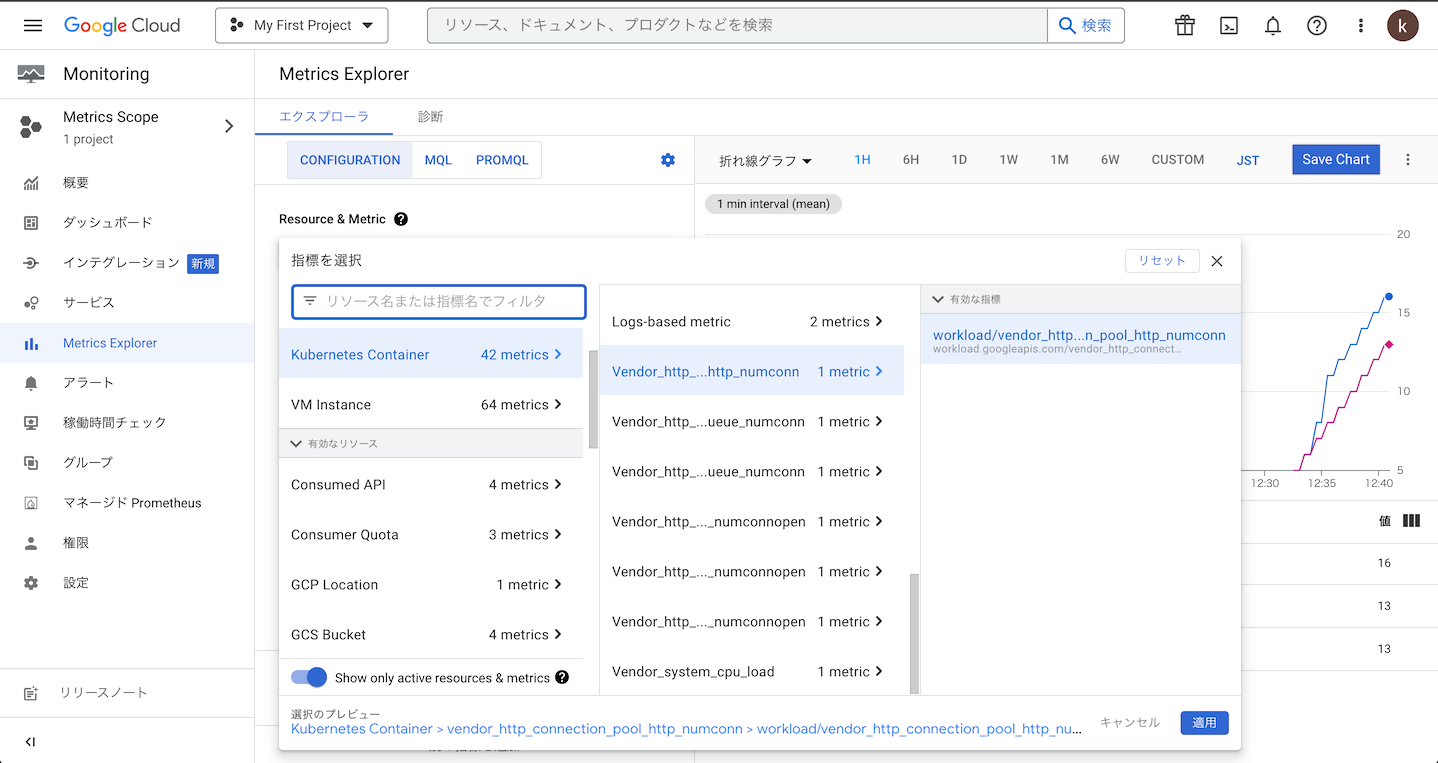
うまく取得できていれば数分ほどでKubernetes Containerリソースでメトリクスが増えていると思います。
metrics.xmlで追加したメトリクスが有効になっていますね!
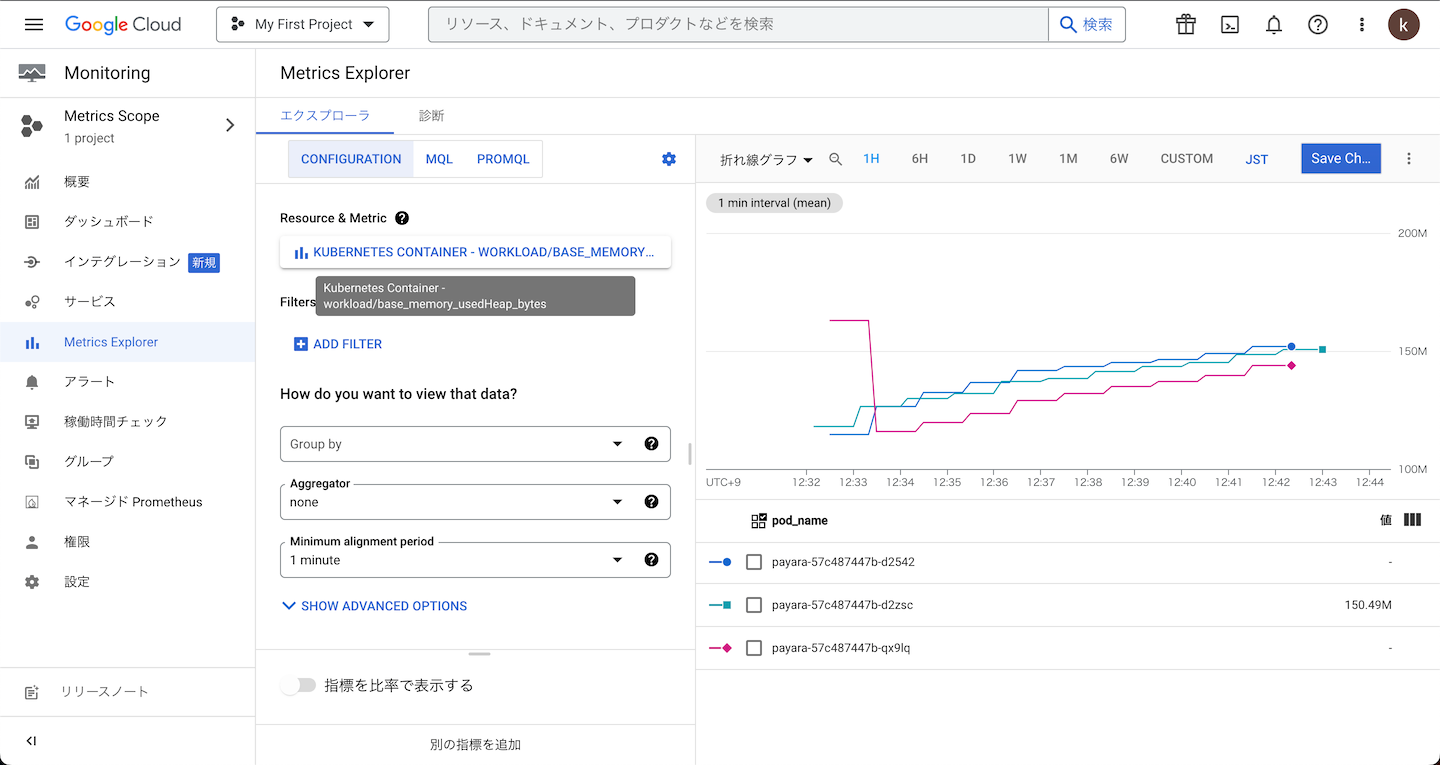
Heapメモリはこんな感じ。3Podとも取れています。
何度も書いてますが、この手順は非推奨です。
この手順で実装したら1.24にアップグレードするときにマネージドPrometheusに移行が必須なんですよねぇ
二度手間やだなー
どうでもいいですが、指標って訳されるよりメトリクスって言われたほうが個人的にはわかりやすいですね。